Equity, Diversity and Inclusion (EDI)
Diversity data
Diversity data inform the University’s aims to advance equity, diversity and inclusion and enable us to track our progress against achieving these. Data about the diversity demographic of our students and staff, and their journey with us, helps us to identify and implement targeted actions to advance equity.
As a higher education provider, we also have a legal duty under the Public Sector Equality Duty (Equality Act 2010) to assess and publish information about the effects our policies and practices have on people across the protected equity groups.
To track our progress against University EDI objectives, and to meet the requirements of the Public Sector Equality Duty, we publish annual equity information reports of our student and staff demographic and lifecycle.
Staff
The staff data provided in these infographics is based on a snapshot of data captured on 1 January 2026.
Sex
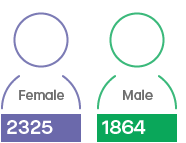
2325 Female; 1864 Male
Ethnicity (broad)
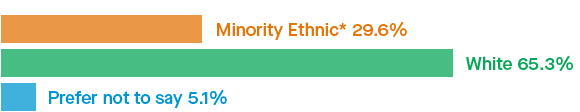
Minority Ethnic* 29.6%; White 65.3%; Prefer not to say 5.1%
Ethnicity (detailed)
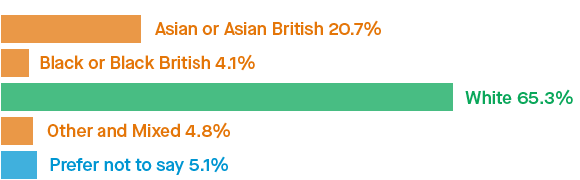
Asian or Asian British 20.7%; Black or Black British 4.1%; White 65.3%; Other and Mixed 4.8%; Prefer not to say 5.1%
Age
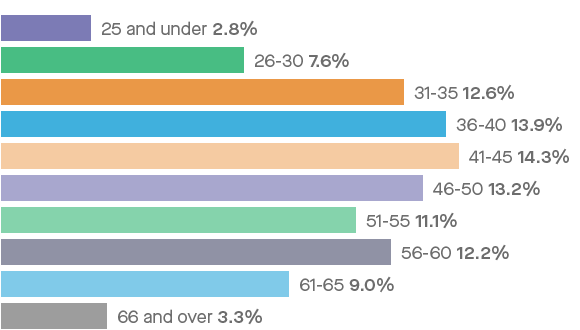
25 and under 2.8%: 26-30 7.6%; 31-35 12.6%; 36-40 13.9%; 41-45 14.3%; 46-50 13.2%; 51-55 11.1%; 56-60 12.2%; 61-65 9.0%; 66 and over 3.3%
Sexual orientation
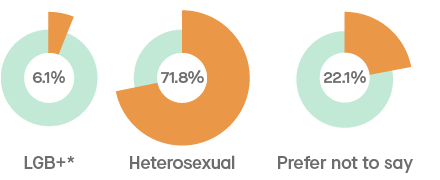
6.1% LGB+*; 71.8% Heterosexual; 22.1% Prefer not to say
*LGB includes: Bisexual, Gay man, Gay woman/Lesbian, Other
Gender identification
When asked if members of staff identified with the gender they were assigned at birth:
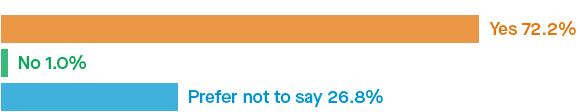
Yes 72.2%; No 1.0%; Prefer not to say 26.8%
Disability
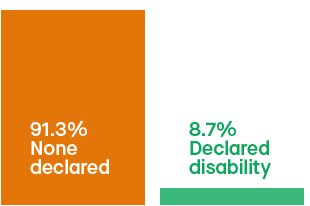
No disability declared 91.3%; Declared disability 8.7%
Religion or belief
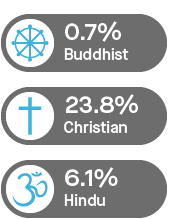
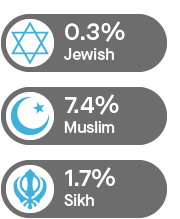
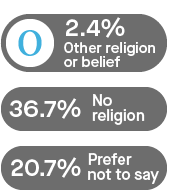
Buddist 0.7%; Christian 23.8%; Hindu 6.1%; Jewish 0.3%; Muslim 7.4%; Sikh 1.7%; other religion or belief 2.4%; no religion 36.7%; prefer not to say 20.7%
Students
The student data provided in these infographics relates to all students (undergraduate and postgraduate, campus-based and distance learners) studying for a University of Leicester degree in academic year 2024/25. The population of this data excludes students that are suspended, dormant or withdrawn on 1 December 2024.
Sex

10977 female; 9840 male; 150 other
Age
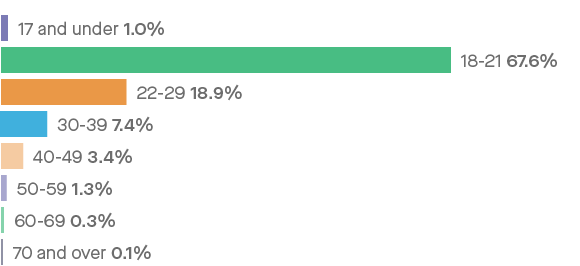
17 and under 1.0%; 18-21 67.6%; 22-29 18.9%; 30-39 7.4%; 40-49 3.4%; 50-59 1.3%; 60-69 0.3%; 70 and over 0.1%
Ethnicity (broad)
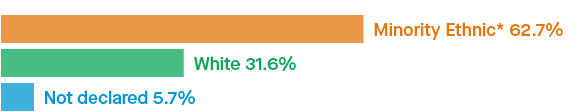
Minority ethnic* 62.7%; White 31.6%; Not declared 5.7%
Ethnicity (detailed)

Asian or Asian British 33.7%; Black or Black British 17.9%; White 31.6%; Other and Mixed 11.1%; Not declared 5.7%
Sexual orientation
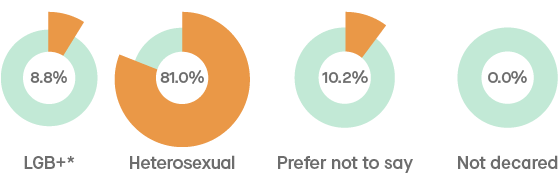
LGB+* 8.8%; Heterosexual 81.0%; Prefer not to say 10.2%; Not declared 0.0%
*LGB+ includes: Bisexual, Gay man, Gay woman/Lesbian, Other
Disability
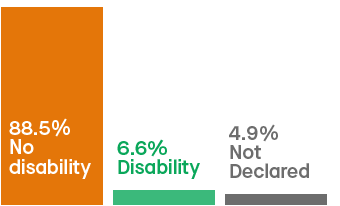
No disability disclosed 88.5%; disclosed a disability 6.6%; not declared 4.9%
Religion or belief


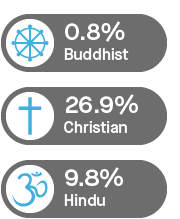
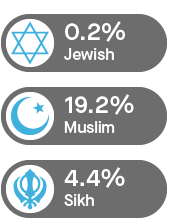
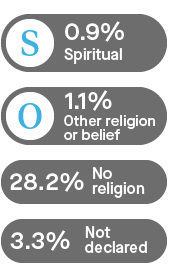
Buddist 0.8%; Christian 26.9%; Hindu 9.8%; Jewish 0.2%; Muslim 19.2%; Sikh 4.4%; Spiritual 0.9%; other religion or belief 1.1%; no religion 28.2%; not declared 3.3%
Equality information reports
Students
- January 2026 (PDF, 410kb)
- January 2025 (PDF, 581kb)
- January 2024 (PDF, 384kb)
- January 2023 (PDF, 800kb)
- January 2022 (PDF, 831kb)
- January 2021 (PDF, 1348kb)
- January 2020 (PDF, 1mb)
- January 2019 (PDF, 526kb)
Staff
- January 2026 (PDF, 506kb)
- January 2025 (PDF, 690kb)
- January 2024 (PDF, 693kb)
- January 2023 (PDF, 949kb)
- January 2022 (PDF, 523kb)
- January 2021 (PDF, 586kb)
- January 2020 (PDF, 611kb)
- January 2019 (PDF, 706kb)
EDI annual reports
- EDI annual report 2026 (docx, 14MB)
- EDI annual report 2025 (docx. 20.7mb)
- EDI annual report 2024 (docx. 5mb)
- EDI annual report 2023 (docx, 12.9mb)
- EDI annual report 2022 (docx, 526kb)
Pay gaps reporting
The University's gender pay gap information can be viewed on the Government website.
- Gender, ethnicity, disability, sexual orientation pay gaps report 2024 (PDF, 2.76mb)
- Gender, ethnicity, disability, sexual orientation pay gaps report 2023 (PDF, 1mb)
- Gender pay gap report 2022 (PDF, 3.15mb)
- Gender pay gap report 2021 (PDF, 4.86mb)
- Gender pay gap report 2020 (PDF, 3.7mb)
- Gender pay gap report 2019 (PDF, 4.4mb)
- Gender pay gap FAQs (PDF, 215kb)
For more information, please see the Government's gender pay gap reporting overview.