JWST peers into the heart of Jupiter’s Great Red Spot
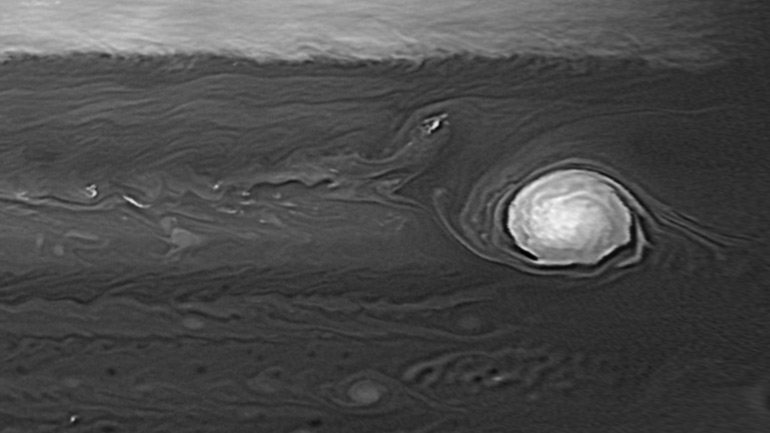
Map of Jupiter’s Great Red Spot from JWST’s NIRCAM instrument at 2.12 µm in July 2022, used to track winds in the upper troposphere for comparison with the deeper atmosphere observed by Hubble in visible light. Credit: NASA/ESA/STScI; Harkett (Univ. Leicester), Hueso (Bilbao), Wong (Berkeley)
Revealing new views of the swirling vortex of Jupiter’s famous Great Red Spot have been unveiled by University of Leicester scientists, who have used JWST to peer deep into the heart of the Solar System’s largest anticyclone.
The images were taken using the MIRI instrument on JWST and have been presented in a new paper for JGR: Planets. University of Leicester engineers and scientists were heavily involved in the MIRI instrument development.
In the accompanying images, maps from MIRI taken in 2022 are overlayed over Hubble and amateur images of the Great Red Spot, and showcase MIRI’s capabilities to measure cloud and thermal contrasts across the vortex. Hubble provides images in visible light but cannot diagnose the chemical composition and temperature of the Great Red Spot; for that, the scientists turned to JWST’s unprecedented new infrared capabilities. The combination of Hubble and JWST wind measurements also enabled direct measurements of the winds in three dimensions, from the churning cloud decks up into the overlying haze layer.
MIRI has four channels, two of which are shown in the false-colour images (below):
Channel 1 (short wavelengths near 5.5 µm, outlined in blue) reveals some reflection from clouds within the vortex, showing up as red. Conversely, blue-green colours indicate bright, deep thermal emission escaping through gaps in the overlying clouds.
Jake Harkett, a PhD student in the School of Physics and Astronomy, and lead author of the new work, said: “This is the first time that we’re seeing a patchiness inside of the Great Red Spot at these wavelengths, indicating differences in cloud thickness – you can see an internal, darker ring in the GRS centre (in the second row).”
Channel 2 (longer wavelengths near 8.6 µm, outlined in green) is primarily sensitive to temperature: darker blue/black implies colder temperatures and thick aerosols, yellow colours show a ring of warmer temperatures and thinner clouds.
Harkett said: “Most importantly, the 3D temperature structure tells us about the dynamics of this famous vortex. We can see that it’s cold in the centre, and that the signature disappears as we go higher and higher in the atmosphere, as the winds that zip around the edge of the storm get slower and slower – the storm weakens by the time we reach the lower stratosphere. The cool temperatures have other important consequences: it makes the vapours, like ammonia and water, condense in the vortex to create the thick clouds. We also saw surprising patches of warmer air, sitting high above the main vortex in the stratosphere, demonstrating that this tropospheric vortex is influencing the motion of air high above.”
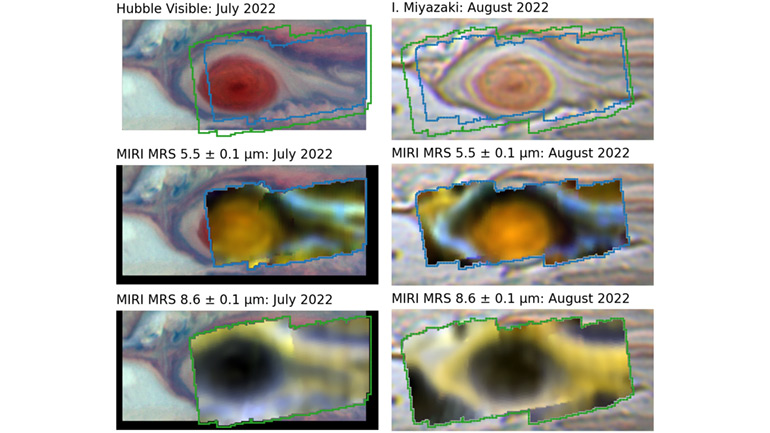
Maps of Jupiter’s Great Red Spot acquired by the MIRI medium-resolution spectrometer in July (left) and August (right) 2022. The top row shows visible-light images from Hubble and an amateur observer (Isao Miyazaki) for context; the central row shows reflection and thermal emission near 5.5 µm; the bottom row shows thermal emission near 8.6 µm. Credit: NASA/ESA/STScI; JWST Observations: Harkett & Fletcher (Univ. Leicester); Hubble Observations: Wong & Simon; August Image: I. Miyazaki
By observing clouds in Jupiter’s atmosphere twice, around 10 hours apart, both Hubble and JWST can track the windspeeds at the edge of the vortex. Hubble senses the deeper clouds, measuring winds as fast as 150 m/s (330 mph). But JWST’s NIRCAM instrument reveals that those windspeeds are much slower higher up, a maximum of 50-70 m/s (110-160 mph) in the upper troposphere. NIRCAM reveals delicate spirals and filaments on the inside of the storm, as this shorter wavelength (2.12 µm) senses aerosols sitting near the top of the vortex.
JWST spectroscopy was acquired in 2022 using two instruments – NIRSpec, which sees reflected infrared light to reveal the structure of Jupiter’s clouds; and MIRI, which sees thermal light and reveals the temperature and gaseous structure in three dimensions. Both of these instruments create images at thousands of individual wavelengths, which can be recombined to spectra. Spectra of the Great Red Spot are rich in detail, containing the fingerprints of numerous gaseous species: ammonia, phosphine and water in the cloud-forming troposphere; methane and a variety of hydrocarbons in the stratosphere.
Professor Leigh Fletcher, the principal investigator for these MIRI observations of Jupiter, said: “By modelling these spectra, we can see that aerosols and phosphine gas are both enriched within the vortex, with aerosols towering up to high altitudes. Maybe phosphine plays a role in generating those mysterious red colours, or maybe the air in the vortex is so calm and stable that it just sits around for a long time, protected from UV destruction by all those aerosols.
“What we can’t see is what’s going on deeper down, below these topmost clouds – that’s something that only the Juno mission, or ground-based observations in the centimetre range, can really do. JWST sees just the tip of the iceberg.”
These observations were particularly challenging for the scientists to obtain: Jupiter is one of the brightest targets for JWST and it required the development of new, custom-made algorithms and techniques over a couple of years to overcome the problem of saturated data.
Professor Fletcher explains: “These observations were among the first that JWST acquired, so we were still learning how to target specific features on big, bright, moving and rotating objects. We used amateur tracking of the storm to provide targeting for JWST, and were delighted when the observatory caught the very centre of the vortex on its first try, like a bullseye.”
But even then, challenges remained: JWST failed to capture the full mosaic on its first attempt due to difficult timing constraints as Jupiter rotates every 10 hours, so Fletcher worked with the team at the Space Telescope Science Institute (STScI) to refine the observing plan and complete the observations just a couple of weeks later.
The University of Leicester has been involved with the James Webb Space Telescope since the early days of the project, providing the Mechanical Engineering Lead for the Mid-Infrared Instrument (MIRI). In collaboration with the Danish National Space Centre, Leicester was responsible for design and provision of the MIRI Primary Structure and provided support for MIRI test and calibration activities. The MIRI observations in programme 1246 were led by Fletcher as part of the Guaranteed Time Observation programme awarded to Dr Heidi B. Hammel. Harkett is supported by a PhD studentship from the Science and Technology Facilities Council (STFC). The NIRCAM observations were from Early Release Science programme 1373 led by Imke de Pater and Thierry Fouchet. Hubble observations in July 2022 were made as part of programme GO-16913 (PI: Michael H. Wong) and the amateur ground-based observations in August 2022 were made by Isao Miyazaki.
- ‘The Thermal Structure and Composition of Jupiter's Great Red Spot From JWST/MIRI’ is published in JGR: Planets, DOI: 10.1029/2024JE008415