College of Science and Engineering
Nuclear Graphite
Preparation of free-standing pillar
Nuclear Graphite
Graphite is hugely important for the construction of both historical and modern nuclear reactors [1], acting as a neutron moderator. Due to the harsh environment of the nuclear reactor, the material properties of the graphite can change throughout the service life. Understanding the microstructure evolution (e.g., porosity), is instrumental for the performance assessment of the material, allowing us to design a safer and longer lasting nuclear reactor.
Characterising over multiple length scales
Nuclear graphite has a ‘hierarchical microstructure’, meaning that we have features ranging from hundreds of micrometres right down to tens of nanometres. This presents a challenge in terms of analysing a large volume (>10mm3) to understand the context and broader structure but also enabling high resolution (<10nm3) in key areas. The combination of MicroCT and LaserFIB (the Hercules solution) can circumvent this challenge.
MicroCT is used to determine the microstructure at the millimetre scale on a bulk sample while also identifying important regions of interest for further analysis. The structure of dense grains and intergranular pores can be easily measured however, the measured porous volume from MicroCT alone gives a value of 12.8%, which clearly doesn’t match the value of 22.7% as reported in [2,3].
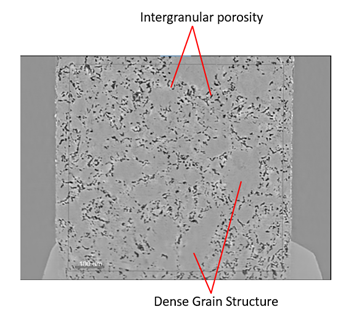
Fig 1: Cross section of graphite sample showing large, intergranular pores and dense grains.
This is because many nanometre scaled porosities in the graphite cannot be resolved by MicroCT. Therefore, a higher resolution analysis (i.e., X-ray Microscopy (XRM)) is required to characterise the sample fully. However, a much smaller sample volume must be prepared to allow this analysis, such as the free-standing pillar.
 |
|
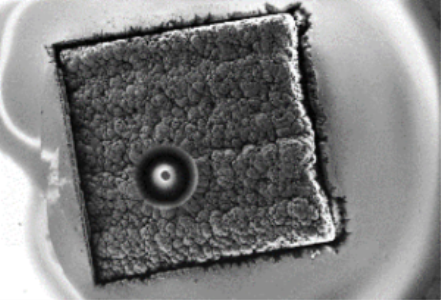 |
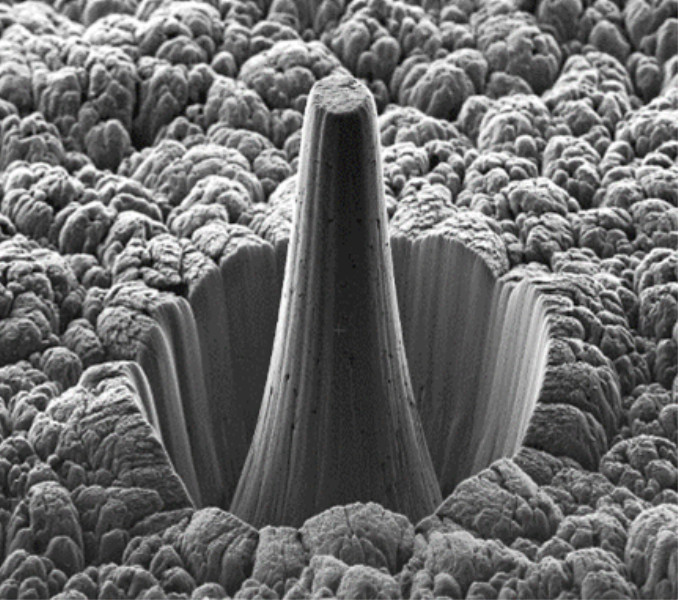
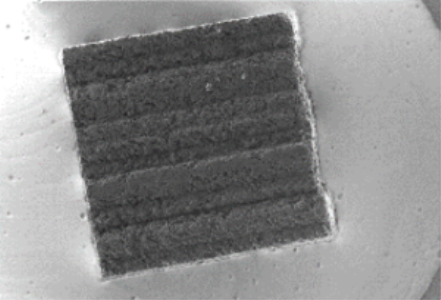
Fig 2: (Top left) as received sample, (bottom left), pillar prepared by femtosecond laser shown from top view, (Right) Prepared nano-XRM pillar, side view (height 300µm, diameter 50µm.
How Hercules solves the problem
Step 1: Micro CT
- Characterisation of mm3 volumes
- Resolution to µm3 scale
Step 2: Laser FIB
- Milling rates of 107 µm/s
- Precision of µm
- FIB for more precise finishing
Step 3: XRM
- Characterise 10's µm3 volumes
- Resolution to nm3 scale
Site specific FIB sample preparation would be your go-to technique to prepare this kind of structure, perhaps a Plasma FIB given its large size. Unfortunately, the hardness and anisotropy of the graphite make it very hard to mill either with plasma or Ga+ FIB at any practical rate. The problem is even more complex if the region of interest is deeply buried in the sample.
Femtosecond Laser, on the other hand, is independent of the material hardness and therefore can mill far more rapidly, preparing this pillar in only 20 minutes. What’s more, due to the short pulses, the laser milling does not suffer from a large heat affected zone (HAZ), meaning the material near the cut will not be affected by the milling.
Correlative workflow
The data obtained in the MicroCT can be easily passed to the LaserFIB, allowing the regions of interest to be rapidly identified and prepared with the femtosecond laser, providing quicker throughput and more confidence in your sample preparation. The XRM data reveals that on top of the intergranular porosity, there is a significant amount of intragranular porosity. Extrapolating this to the remainder of the intragranular region identified in MicroCT, the porosity value is calculated as 20.5%, far closer to the expected value [2,3]. Without this multimode approach, offered by the Hercules solution, it wouldn’t be possible to measure the porosity and also understand the microstructure.
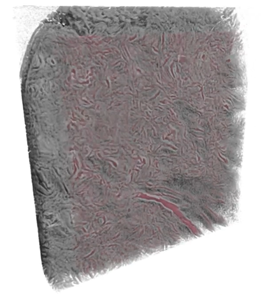
Fig 3: 3D-reconstruction from X-ray microscopy data showing nanoscale pores in dense granular region as imaged in pillar prepared by femtosecond laser.
- [1] J. Kane et al. Journal of Nuclear Materials, vol. 415, 2, pp189-197, 2011
- [2] T.Oku, M.Eto and S. Ishiyama, Journal of Nuclear Materials, vol. 172, no. 1, pp 77-84, 1990
- [3] T. Burchell, Carbon, vol 34, no.3, pp 297-316, 1996