Revealing branching time in single-cell omics data
New single-cell omics technology allows scientists to analyse cell development in ways that were not previously possible. Researchers can now identify never-before-seen patterns and phenomena across large quantities of cells - receiving information about genomes, gene expression, and cell heterogeneity for thousands of cells from a single organism simultaneously. This new technology has been named 2018 Breakthrough of the Year by the prestigious journal Science.
The mountain of single-cell data is huge and beautiful but with this data comes a new big data challenge: it is necessary to extract interesting and useful knowledge from them. How to join cells (represented by points in a multidimensional space) into trajectories of their development? How to find branching, bifurcating points where cells choose and change their “specialization”?
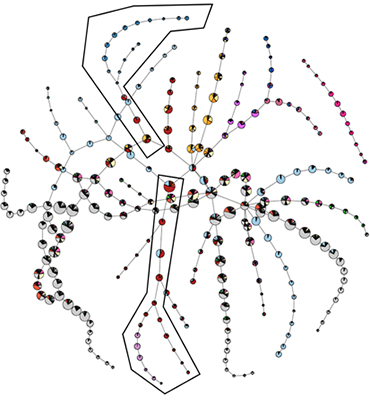
Trajectories of development with all their peculiarities and singularities form the so-called branching pseudotime of development. The technology for solving these problems was developed by an international team including Professor Alexander Gorban, Director of the Mathematical Modelling Centre and Professor of Applied Mathematics at the University of Leicester, published this week in a paper in Nature Communication.
The new technology, called STREAM (Single-cell Trajectories Reconstruction, Exploration and Mapping) is an interactive pipeline capable of disentangling and visualising complex branching trajectories from both single-cell transcriptomic and epigenomic data. It allows scientists to analyse cell development in ways that were not previously possible.
STREAM detects potential marker genes of different types: diverging genes, i.e. genes important in defining branching points that are differentially expressed between diverging branches, and transition genes, i.e. genes for which the expression correlates with the cell pseudotime on a given branch.
STREAM includes advanced tools for visualisation of branching pseudotime as a subway map or a stream plot and for mapping of a new cell or cell density on the pseudotime plot.
The mathematical core of STREAM is based on the methods of principal elastic graphs and topological grammars developed at the University of Leicester in collaboration with the Institut Curie, Paris. The basic algorithms were redesigned into an open access software, ElPiGraph, by a larger international team. The final product, STREAM, was designed, implemented and tested by a large team of 17 institutions from six countries and is now freely available at github.
Professor Gorban led the Leicester group of researchers. On the publishing of the paper and the launch of the software, he said: “I am very happy - it is a great pleasure to see how our constructions of principal graphs and topological grammars, developed together with Andrei Zinovyev at the Institut Curie and Evgeny Mirkes from Leicester, are transformed into an efficient universal tool for the extraction of topological and geometric features from complex data, and then into a new technology for the analysis of single cell data.
“The first idea was simple: approximation of complex data can be constructed by a sequence of simple operations. The list of these operations (the grammar) can be postulated a priori or deduced from data. The devil is in the details, in precise implementation of this scheme with optimisation at each step.
“I am very grateful to all the collaborators for their ideas and their work on this fascinating journey! Our special gratitude to Luca Pinello from Harvard University, who gathered and organised the STREAM team for the final effort.”
Professor Reiko Heckel, Professor in Software Engineering at the University of Leicester and president of the European Association for Software Science and Technology (EASST), said: “Graph grammars, which provide the foundation for topological grammars allowing us to discover the elastic graph structure behind the data, have been developed over more than 40 years as a mathematical tool to describe and analogise the generation and manipulation of graphs. Their applications range from maths and computer science to biology and engineering.
“The STREAM approach represents an original and significant extension of their scope of application to the area of large-scale data analytics. I’m convinced that this work will open up new areas of research in graph grammars, as well as demonstrating their usefulness in this exciting new application domain.”
Dr Andrei Zinovyev, Scientific Coordinator of Computational Systems Biology of Cancer team, Institut Curie, Paris, said: “Currently many groups develop computational methods for revealing branching pseudotime in single cell data, but STREAM with its algorithmic core ElPiGraph is distinguished in several aspects:
- It is a very user-friendly tool and can be used as a simple online application and provide insightful data visualisation.
- It is applicable to very large datasets and can stand for large level of noise in the data, which is important for the single cell level molecular measurements.
- STREAM has been tested on an impressive amount of existing data and on average showed more robust results than other tools did.
“It is already used by our collaborator groups for understanding the properties of cells residing in the tumoral microenvironment or for studying the intratumoral heterogeneity of paediatric cancers. We see potential applications of STREAM in Human Cell Atlas and LifeTime European Flagship projects, both aimed at understanding human organism at single cell level and already generating an unprecedented amount of molecular data.”
The paper ‘Single-cell trajectories reconstruction exploration and mapping of omics data with STREAM’ was published by Nature Communication on 23 April 2019. https://doi.org/10.1038/s41467-019-09670-4

Figure: The branching time for single-cell transcriptome of planarians. The associations of the different cell types to the nodes is reported on a plane with a pie chart for each node. Two branches are highlighted for further analysis (A CC BY 4.0 figure from https://arxiv.org/pdf/1804.07580)